
Your guide to email infographics for increasing engagement
Dive into the world of infographics, where data meets design, to create visually compelling stories that inform and captivate your audience.
As a marketer, you’ve spent countless hours looking for ways to make your content better and your email marketing more effective. The simple answer is that there isn’t a perfect formula.
Not only is every audience unique in their interests and what appeals to them but even the tastes of the same audience change over time…they’re people, after all. That’s why email marketing is all about using a variety of strategies to make your emails more engaging and compelling, and one of these strategies is using infographics.
What are email infographics?
An email infographic is a graphic with the intent to communicate data or complex topics in a condensed way.
You could use email infographics to share the results of a recent survey, for example, or review how your brand has grown in the past year. According to Search Logistics, infographics are 30 times more likely to be read than written articles.
Types of email infographics
There are limitless ways to use infographics in your email campaigns, for instance:
- Data/statistical: This is the most common form of infographics and is used to display data like survey results or statistics on how customers use your products.
- Process: Displays step-by-step instructions, like an onboarding guide or how to set up an account.
- Geographical: Display data specific to a geographical location, such as where a majority of your customers are based. This often takes the form of a pie chart.
- Lists: Bulleted lists to give a quick overview of information, such as a list of your best performing products.
- Comparison: Used to compare options side by side, like comparing two of your products or your products vs a competitor. Usually, it takes the form of a table.
- Hierarchical: Used to demonstrate the performance of various data points, like a ranking of your most comprehensive products to your most basic products
- Timeline: Shows the progression of events, like your company history.
Benefits of using infographics in email marketing
Email infographics are more than just an interesting and different way to communicate information. There are several benefits to incorporating them into your email marketing.
Increased engagement
Infographics bring in three times more engagement than other content on the same platforms. Higher engagement with your email marketing could translate to more clicks onto your website, more purchases, and stronger brand loyalty.
Enhanced readability
Email infographics can make your content easier for your readers to digest. A public safety study found that visuals can improve reading comprehension by 50%.
Better retention
According to MedTech Intelligence, people retain about 65% of information when visuals are involved, compared to 10% of text-only information.
How to create effective email infographics
With all the potential that email infographics can bring to your next marketing campaign, how do you take advantage of that potential?
1. Have a goal in sight
Before you dig in and start creating your infographic, set an objective. What information are you trying to communicate? What do you want that information to mean to the readers?
What do you ultimately want to result from this infographic? Is it more sales for a particular product or stronger customer loyalty?
An effective infographic should have a clear goal in mind. Be sure that you know your audience well enough to know what type of information or design resonates best with them.
2. Use strategic design
As you know, designing for marketing is so much more than “making it look cool.”
- Choose a color scheme consistent with your brand to build brand familiarity.
- Keep the design simple, so it’s easy to read at a glance.
- Use legible fonts that are easy to read.
- Lay out and size your text strategically to draw readers’ eyes toward the most important points.
- Use the “less is more” rule. Too much clutter is distracting, so your readers might not grasp as much information.
3. Strike a balance between text and visuals
An infographic is all about presenting written information in a visual way, so the trick is to make sure your text and visuals are balanced.
A few well-placed visuals like maps and icons can help to illustrate your point and engage readers, but too many of them could look cluttered and distracting. Aim to use about the same amount of space for visuals and text. According to DesignCrowd, this creates a feeling of harmony and comfort for readers.
Remember that blank space is an important design element in infographics, too. Leaving plenty of space makes your infographic more readable and can help direct the reader's eyes where you want them to go.
4. Design for mobile first
Design your email infographic based on how it will look for someone viewing it on their phone. According to Upland Software, not only are most emails opened on mobile devices today but 52% of users are less likely to engage with your email if the mobile experience isn’t good.
Make sure your infographic is visually appealing and easy to read by testing how it will look on various devices, email clients, and screen sizes.

5. Make sure it loads smoothly
According to Email on Acid, acceptable email loading times range from 2 to 4 seconds for different types of connections.
Design your email infographic for fast loading by keeping high-resolution images to a minimum and using email-friendly file formats like JPEG, PNG, and GIF.
6. Try out options with A/B testing
You won’t fully know whether an infographic is well-designed until you see how it performs in a real email campaign.
There are many factors that affect how an infographic (or any email) performs so try A/B testing: send one version of the infographic to half of your target audience and another version to the other half. See which one scores better on metrics like open rates, click-through rates, and conversions.
Exceptional email infographic examples
Now that you have all the pro tips, it’s time to get inspired. Start gathering ideas for your next email infographic with these skillful designs.
Statistical infographic from Grammarly
Grammarly is known for the interesting weekly update infographics that they send out to each user. Each one is filled with the user’s stats for that week like how many words they wrote that week and where they ranked among other users, their typical writing tone, and more.
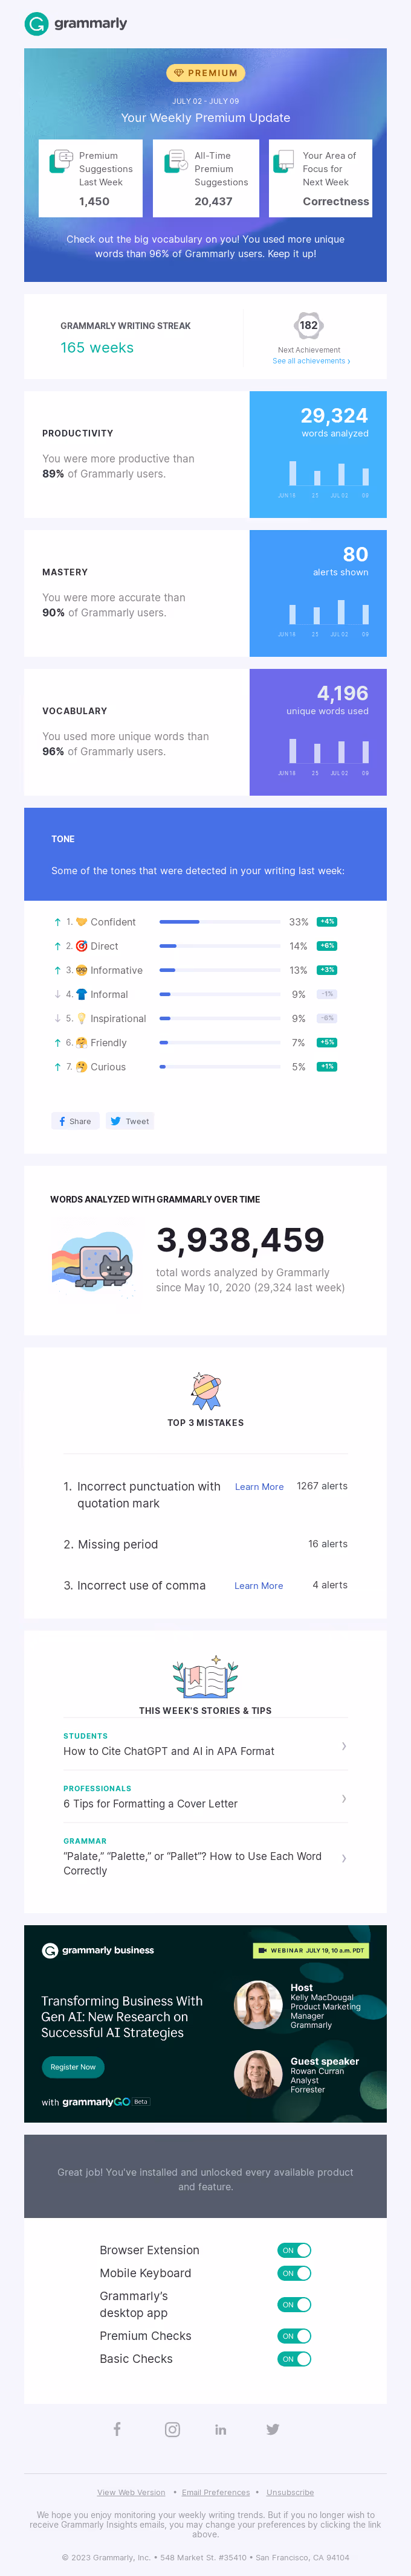
Why it works:
- Uses on-brand colors that build brand familiarity
- Displaying information that is relevant and interesting to users
- Leaving enough blank space to call attention to the data and avoid a cluttered look
Process infographic from Omsom
Omsom’s infographic is a helpful guide that tells users how to plan a Valentine’s Day date that their special someone will love…while using Omsom’s product, of course.

Why it works:
- Uses a bold and rather simplistic design to keep the reader focused only on the infographic
- Presents relatable content in the days before Valentine’s Day for customers who are trying to decide on their plans
- Starts with a clear, to-the-point title that states exactly what the purpose of the email is
Geographic infographic from Zillow
This infographic from Zillow is a personalized look at some key markers in the real estate market that the user is interested in. It’s an excellent way to re-ignite the user’s thoughts about buying a home and show them what’s waiting for them.

Why it works:
- Highly personalized with the specific zip code that this users has been watching
- Uses a simple design to keep the user’s focus on the information they want to present
- Includes a call to action at the end, encouraging the user to take the next step with a loan pre-approval
Tools and resources for creating email infographics
Ready to start creating your own effective and eye-catching email infographics? There are plenty of tools out there to help so you can reap the benefits of infographics without expert graphic design knowledge. Check out these favorites:
- Beefree: An email design tool with a library of templates so you can design your infographic directly inside your email design rather than designing it as an image and embedding the image in the email (although that’s possible with Beefree, too)
- Piktochart: Software specifically for creating infographics or visual elements for infographics, like charts and graphs.
- Canva: A user-friendly design software for people without design expertise, offering customizable image templates so you can create your infographic as an image.
- Visme: An infographic design tool that has an easy drag-and-drop interface to customize your infographic elements.
- Shutterstock: Site where you can buy vector images for infographics that you can customize using design software, and where you can buy icons or other visuals to use in your infographics.
- Venngage: Infographic design tool that has templates for all types of infographics across a wide range of styles and aesthetics.
- Snappa: A tool for when you need an infographic in a hurry, boasting that you can have an infographic complete in just five minutes thanks to their templates, stock images, and more.
Free infographic email templates
A well-designed template can make it easy to create an effective email infographic for your next campaign. Beefree has a variety of templates that use infographics so you can customize them for your campaign. Try these for a start:
- Share the growth of your organization
- Share the results of your latest surveys
- Share your client's progress in a simplified and engaging way
- Share step-by-step instructions